- The characteristics of exposure and the spectrum of toxic effects come together in a correlative relationship customarily referred to as the dose–response relationship.
- Whatever response is selected for measurement, the relationship between the degree of response of the biological system and the amount of toxicant administered assumes a form that occurs so consistently as to be considered the most fundamental and pervasive concept in toxicology.
From a practical perspective, there are 2 types of dose-response relationships:
Individual
- Describes the response of an individual organism to varying doses of a chemical, often referred to as a “graded” response because the measured effect is continuous over a range of doses
- Individual dose–response relationships are characterized by a dose-related increase in the severity of the response.
Quantal
- Characterizes the distribution of individual responses to different doses in a population of individual organisms.
- Any given dose, an individual in the population is classified as either a “responder” or a “nonresponder.” Although these distinctions of “quantal population” and “graded individual” dose–response relationships are useful, the 2 types of responses are conceptually identical
It is also important to recognize that a given chemical may have multiple different molecular, biochemical, and cellular effects, each with its own “dose–response” relationship.
A widely used statistical approach for estimating the response of a population to a toxic exposure is the “effective dose” (ED). Generally, the midpoint, or 50%, response level is used, giving rise to the “ED50” value.
A graphical representation of an approximate ED50 is shown in figure below:
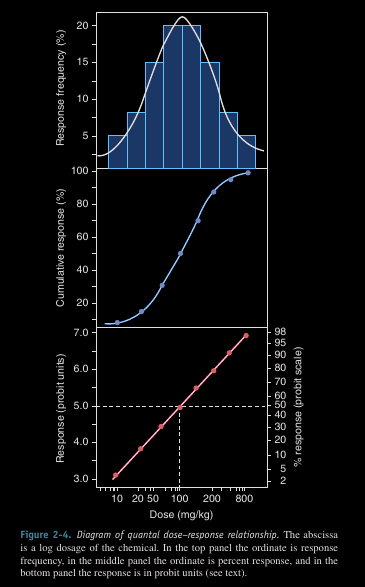
Note that these data are “quantal.” Where death is the measured end point, the ED50 would be referred to as the LD50.
FREQUENCY OF EXPOSURE
Toxicologists usually divide the exposure of experimental animals to chemicals into 4 categories:
ACUTE
- Is defined as exposure to a chemical for less than 24 hours, and examples of exposure routes are intraperitoneal, intravenous, and subcutaneous injection; oral intubation; and dermal application.
- Whereas acute exposure usually refers to a single administration, repeated exposures may be given within a 24 hour period for some slightly toxic or practically nontoxic chemicals.
- Acute exposure by inhalation refers to continuous exposure for less than 24 hours, most frequently for 4 hours.
SUBACUTE
- 1 month or less
- Repeated exposure can be by any route
SUBCHRONIC
- 1 to 3 months
- Repeated exposure can be by any route
CHRONIC
- More than 3 months
- Repeated exposure can be by any route
In human exposure situations, the frequency and duration of exposure are usually not as clearly defined as in controlled animal studies, but many of the same terms are used to describe general exposure situations
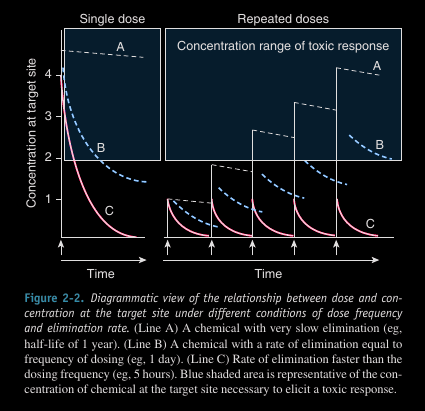
For many chemicals, the toxic effects that follow a single exposure are quite different from those produced by repeated exposure. For example:
- The primary acute toxic manifestation of benzene is CNS (Central Nervous System) depression, but repeated exposures can result in bone marrow toxicity and an increased risk for leukemia.
Acute exposure to chemicals that are rapidly absorbed is likely to produce immediate toxic effects but also can produce delayed toxicity that may or may not be similar to the toxic effects of chronic exposure.
BODY WEIGHT INFLUENCE
One might also view dosage on the basis of body weight as being less appropriate than other bases, such as surface area. The relationship between body surface area and body weight across most mammalian species is closely described by the formula:
SA = 10.5 * (body_weight_grams) * 0.67Empirical comparisons of toxicity data across species confirm that this relationship is appropriate for toxicological scaling.
POTENCY VS EFFICACY
To compare the toxic effects of 2 or more chemicals, the dose response to the toxic effects of each chemical must be established. One can then compare the potency and maximal efficacy of the 2 chemicals to produce a toxic effect.
Efficacy: reflects the limit of the dose–response relationship on the response axis to a certain chemical.Potency: efers to the range of doses over which a chemical produces increasing responses.
These 2 important terms can be explained by reference to the figure below:
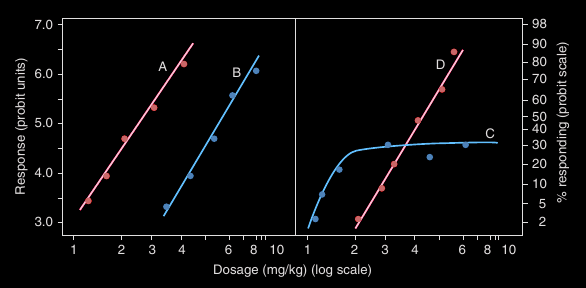
This figure depicts dose–response curves to 4 different chemicals for the frequency of a particular toxic effect, such as the production of tumors.
- Chemical A is said to be more potent than chemical B because of their relative positions along the dosage axis.
- Thus, A is more potent than B and C is more potent than D.
- Chemicals A and B have equal maximal efficacy, whereas the maximal efficacy of C is less than that of D.