https://towardsdatascience.com/understand-data-normalization-in-machine-learning-8ff3062101f0
https://towardsdatascience.com/data-normalization-in-machine-learning-395fdec69d02
Why Should You Standardize / Normalize Variables:
Standardization:
Standardizing the features around the center and 0 with a standard deviation of 1 is important when we compare measurements that have different units. Variables that are measured at different scales do not contribute equally to the analysis and might end up creating a bais.
For example, A variable that ranges between 0 and 1000 will outweigh a variable that ranges between 0 and 1. Using these variables without standardization will give the variable with the larger range weight of 1000 in the analysis. Transforming the data to comparable scales can prevent this problem. Typical data standardization procedures equalize the range and/or data variability.
Normalization:
Similarly, the goal of normalization is to change the values of numeric columns in the dataset to a common scale, without distorting differences in the ranges of values. For machine learning, every dataset does not require normalization. It is required only when features have different ranges.
For example, consider a data set containing two features, age, and income(x2). Where age ranges from 0–100, while income ranges from 0–100,000 and higher. Income is about 1,000 times larger than age. So, these two features are in very different ranges. When we do further analysis, like multivariate linear regression, for example, the attributed income will intrinsically influence the result more due to its larger value. But this doesn’t necessarily mean it is more important as a predictor. So we normalize the data to bring all the variables to the same range.
When Should You Use Normalization And Standardization:
Normalization is a good technique to use when you do not know the distribution of your data or when you know the distribution is not Gaussian (a bell curve). Normalization is useful when your data has varying scales and the algorithm you are using does not make assumptions about the distribution of your data, such as k-nearest neighbors and artificial neural networks.
Standardization assumes that your data has a Gaussian (bell curve) distribution. This does not strictly have to be true, but the technique is more effective if your attribute distribution is Gaussian. Standardization is useful when your data has varying scales and the algorithm you are using does make assumptions about your data having a Gaussian distribution, such as linear regression, logistic regression, and linear discriminant analysis.
Several methods are applied for normalization, three popular and widely used techniques are as follows:
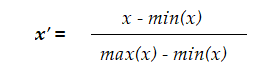
- Rescaling: also known as “min-max normalization”, it is the simplest of all methods and calculated as:
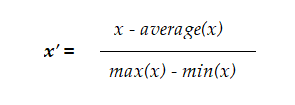
- **Mean normalization: **This method uses the mean of the observations in the transformation process:
- Z-score normalization: Also known as standardization, this technic uses Z-score or “standard score”. It is widely used in machine learning algorithms such as SVM and logistic regression:
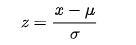
Here, z is the standard score, µ is the population mean and ϭ is the population standard deviation.
Normalization does some good things but creates some bad side effects along the way.
Normalization compresses data within a certain range, reduces the variance and applies equal weights to all features. You lose a lot of important information in the process.
If you want to normalize your data, you can do so as you suggest and simply calculate the following:
where x = (x1, (...), xn) and zizi is now your ithith normalized data. As a proof of concept (although you did not ask for it) here is some R code and accompanying graph to illustrate this point:
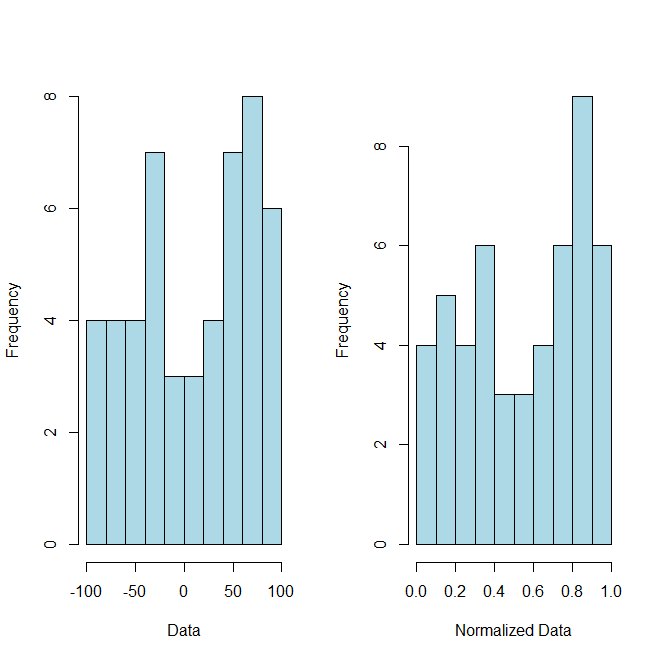
# Example Data
x = sample(-100:100, 50)

#Normalized Data
normalized = (x-min(x))/(max(x)-min(x))